A new sneak peek post and even more excitement comes with it! We are going to tackle a very important topic in the upcoming ClickHelp release - your user's satisfaction with the technical docs you create.
You sure have a general idea about how readable your user manuals are. But, does this idea have any real scientific proof? Well, ClickHelp is going to help you with that via our new awesome readability formulae available in the March product update.
We have developed a precise and intricate mechanism to evaluate readability of your technical documentation using various metrics. Analyzing some metrics gives you a shortcut to understanding your readers better and adjusting your team's writing style to their needs while others allow gaining more control over the team's efficiency.
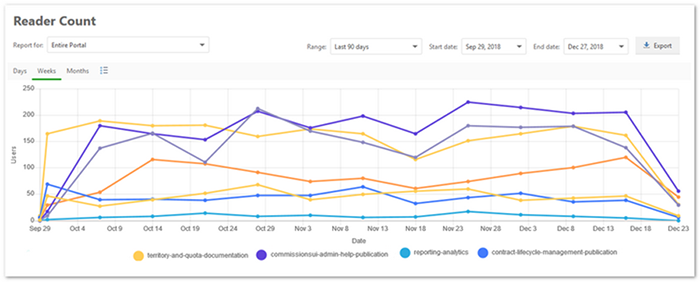
We have also added a new report type - Reader Count. This functionality deals with unique reader views and, along with existing ClickHelp reports, can paint you a realistic picture of how users behave when they get on your online documentation portal.
Brand New Readability Metrics
The new metrics that will become available in the March ClickHelp release allow a very deep and detailed analysis of text.
You can find some of them right at the top of the WYSIWYG editor:

Even Time to read and Readability (FRES) alone can instantly give you an idea of what the topic in question is like.
The ClickHelp team added dozens of useful metrics you can analyze. You can select to display any metric at the top of the page by clicking the cog wheel icon and selecting the one you need.

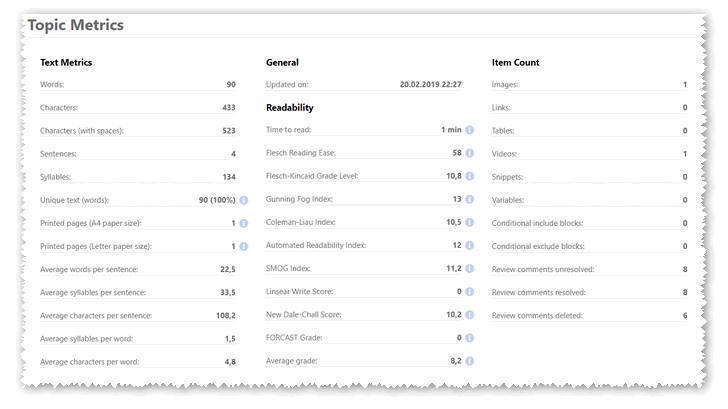
The new metrics are grouped into: Text Metrics, General, Readability and Item Count.
You can examine all of the metrics on one screen:

Readability metrics are calculated with many factors in mind. ClickHelp analyzes text on different levels to provide you with a score.
Let's take Flesch Reading Ease and Flesch-Kincaid Grade Level as an example; these particular readability indexes are tied to the American school grades system. Basically, when you get a certain score, you will understand what hypothetical background a reader needs to have to easily read this topic.
When analyzing topics based on different indexes, pay special attention to the extremes. If all your topics are getting pretty much the same score within one metric, everything is fine. But, if you stumble upon topics with unusually high or low scores, double-check them, something must be off.
Comparing scores of different technical writers is another way to benefit from readability metrics. If some team members keep getting lower scores, they might have poor writing habits, like, their sentences tend to be too long or they contain too many terms. When you possess this knowledge you can turn this situation around pretty quickly.
It goes without saying that more readable text equals shorter sentences, more lightweight grammatical structures, and frequently used words. Now, all this is trackable and visible with the Text Metrics.
Tracking employees’ performance via Text Metrics is also possible. For example, you can figure out how many words a technical writer is supposed to write in a week and check how all team members are doing as far as the word count is concerned. Of course, this approach cannot guarantee high proximity, but, conclusions can definitely be made based on it.
Reader Count Report
We are excited to tell you about the new Reader Count report implemented in the March update. The powerful reporting system of ClickHelp has just received another awesome feature - since the March ClickHelp update, you will be able to see the number of unique users who visited your documentation for a specific period of time. This info can be generated for the entire online documentation portal, or just be specific for a user manual.

As for Restricted Manuals, the details table will give information on which specific Power Readers viewed your documentation.
Studying such statistics can be extremely useful in long term planning. One way to apply it is to see which help topics get more views and treat them with more attention - these topics need to be updated timely and constantly improved and elaborated.
Conclusion
Taking advantage of all new metrics and reports will ensure even more control over the help writing process for our clients as well as the content they are creating.
More sneak peeks into the March ClickHelp release are coming, so, stay tuned for our blog updates. We have a lot of awesome stuff to share with all of you!
Good luck with your technical writing!
ClickHelp Team
Author, host and deliver documentation across platforms and devices