Working with Data Tables
Data Tables have many useful features that will help you manage the working process of your technical writing team. Sorting, grouping, and filtering help to examine the details of every chart. This topic will teach you how to use these features:
Sorting
If you want to sort topics, click a column header and sort them ascending or descending.
Grouping
If you want to group topics, drag and drop a column header to the grouping zone above the table header. In this way, you can group the topics by projects, statuses, and other fields.
Let's group topics by projects and statuses.
By grouping topics in such a manner, you can examine how many topics have Draft and Under Review statuses in different projects, their assignees, modification date, and more.
To reset the grouping, you need to drag a column header back to the headers row:
Filtering
There are different types of filters:
- predefined quick filters (available on the Reviewer Dashboard);
- custom filters;
- columns filters.
Predefined Quick Filters
You can select the necessary quick filter from the dropdown list in the upper left corner of the Reviewer Dashboard. Here is what they look like:

They help to apply the most popular filters quickly. For example, if the topics are assigned to reviewers in the Under Review status (the recommended workflow), click Under Review ASSIGNED TO ME. You'll see only topics that are under review and assigned to you. So, reviewers can treat the dashboard as their personal ToDo list of topics to review. To turn off a filter, click Clear.
Custom Filters
You can specify a custom filter by using the Create Filter button at the bottom of the page. In cases when you need something more complicated and custom, use this button.
Let's see how this works. For example, you need all topics with the Draft status of the Making robots project:
- Click Create Filter.
- You'll see Filter Builder. Click
 to create a filter.
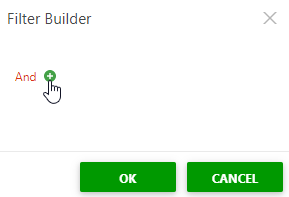
- Specify the filter conditions.
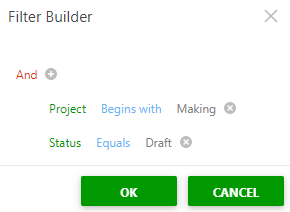
- Click OK.
To edit a filter, click the Filter condition line that is at the bottom of the data table. To remove a condition, click  while editing a filter. To turn off filtering, click Clear.
Column Filters
To explain how to use these filters effectively, let's look at a practical use case.
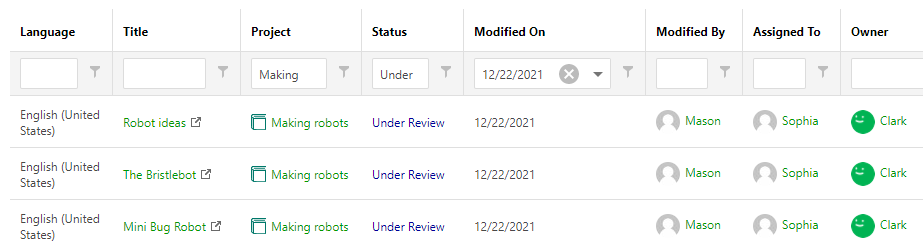
You need all topics with the Under Review status of the Making robots project, and they should be modified on 12/22/2021. To achieve this, type in the filter text in the edit boxes below the corresponding column headers. The data table will be filtered, and you will see only the matching topics there.
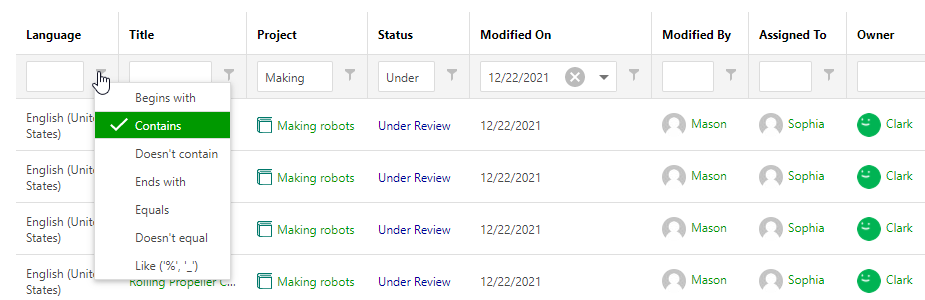
It is possible to change the filtering condition - just click the dropdown button to the right of the filter box.
All filtering settings are saved automatically once they are applied. So when you visit the Reviewer Dashboard page again, you'll see the filters in the state you customized them last time.
Exporting
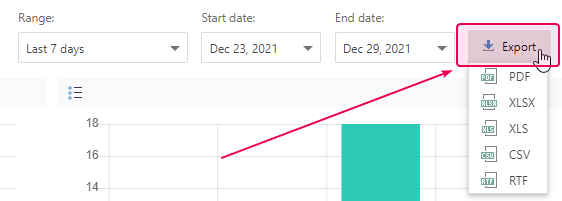
You can export your analytics. Just click Export in the top-right corner of a chart, and pick a format.
Note that in the Topic Views and Ratings section, when you select one of the publications in the Report for dropdown, two more export options will be available to you:
- XLSX (without details)
- XLS (without details)
These two options allow exporting the data to an Excel Sheet without any detailed information about the topic views so that the resulting file can be used for analysis more efficiently.