Project Readiness by Topics Report
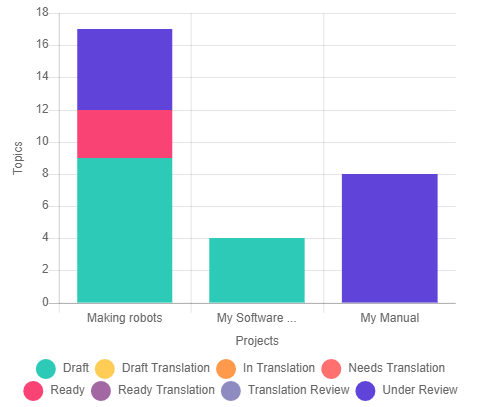
You can open the By Topics report from Projects page by clicking Portal → Reports in the left-hand navigation panel. The Report Center page will open. Click Project Readiness → By Topics in the left-hand navigation panel. You'll see two charts. The first one shows the distribution of topics by Status in each of your projects.
The second chart shows topic distribution by status grouped by the current Assignee.
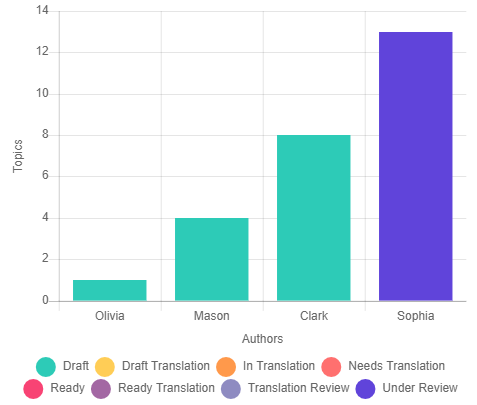
How to interpret this chart? Here is a use case. Olivia is a writer. She finished working on topics and assigned them to Sophia for review. And other writers assigned topics to Sophia. As a result, 13 topics are assigned to Sophia and Olivia has only 1 draft. It means that Sophia became a bottleneck in the work process, and the chart helps the team manager identify the problem and solve it.
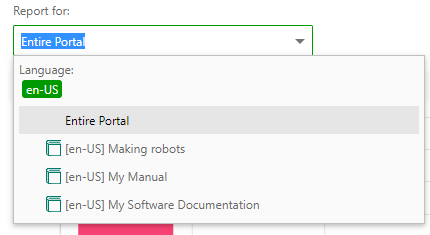
If you need to examine data for a specific project, use the Report for combo box in the page header.
Once you select a project, the chart will look like this:
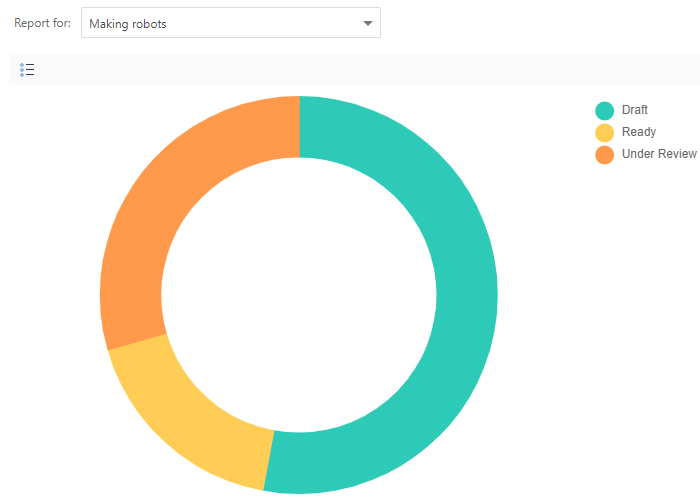
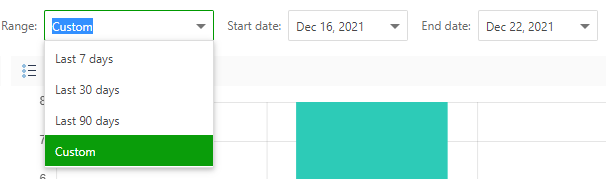
Moreover, you can select a pre-defined date range, or select a custom range by using the Range combo box in the page header.
If you need, you can group, sort, and filter topics. To learn more about these features, refer to Working with Data Tables.