Topics Views and Ratings Report
You can monitor your readers' behavior - positive and negative reactions. You can open the Topic Views and Ratings report from Projects page by clicking Portal → Reports in the left-hand navigation panel. The Report Center page will open. Then click Reader Behavior → Topics Views and Ratings in the left-hand navigation panel.
You'll see a chart that shows Topic Views.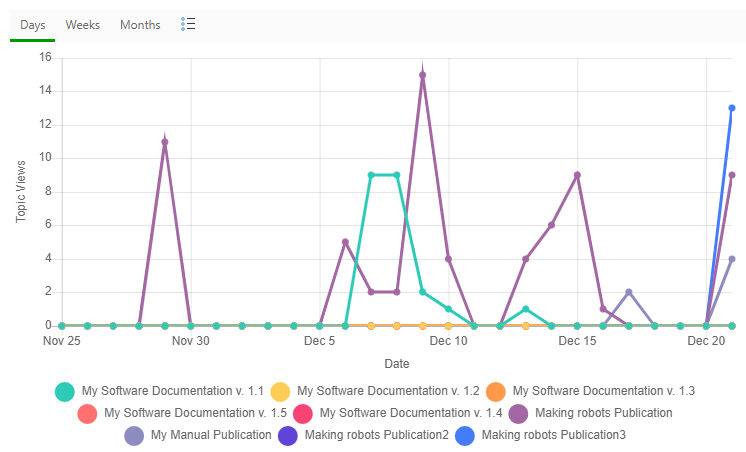
There is a data table under the chart with more data. Here is what it looks like: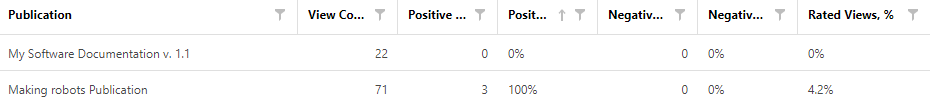
How does your publication get positive and negative ratings? When readers visit your publication the following widget appears in a few seconds.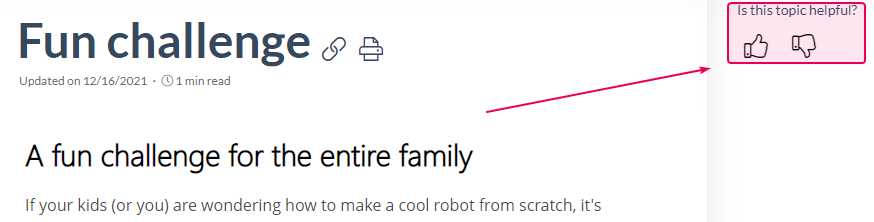
Depending on which option a reader clicks, the topic gets a negative or a positive vote.
How to interpret the table? Here are the descriptions for each column:
- View Count. The number of topic views in a specific publication.
- Positive Ratings. The number of the "Yes" button clicks.
- Positive, %. The percentage of the "Yes" button clicks as a fraction of the total number of votes.
- Negative Ratings. The number of the "No" button clicks.
- Negative, %. The percentage of the "No" button clicks as a fraction of the total number of votes.
- Rated Views, %. The percentage of the views when a reader clicked "Yes" or "No" as a fraction of the total number of views. The system doesn't count bots and contributor views, only readers are taken into account.
All the screenshots above represent the Entire Portal view of data. You can see the same reports for a specific project - just select it in the Report for dropdown box in the report header panel. Moreover, you can group, sort, and filter the content of the data table. Learn more on this here: Working with Data Tables.