Words Added Report
The Words Added Report section allows you to estimate each writer's content contribution to each project, measuring the contribution by counting the number of words added. You can view the statistics for specific writers or specific projects, and you can check the list of top contributors for a specific time period.
By Contributors
To look through analytics on the level of writers, click Reports → Words Added → By Contributors. The chart will show a separate data series for each of your writers, so you can see a historical trend. Hover the mouse pointer over any data point on the chart, and you'll see how many words were added by that specific writer.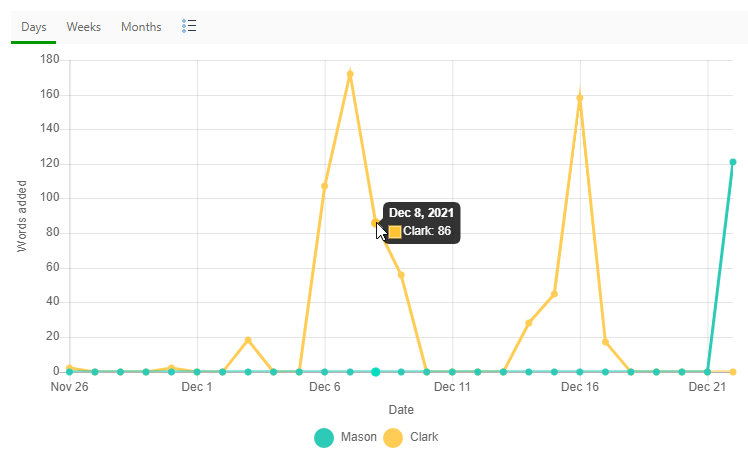
Top Contributors
Want to know who are the Top Contributors during a specific time period? Go to Reports → Words Added → Top Contributors.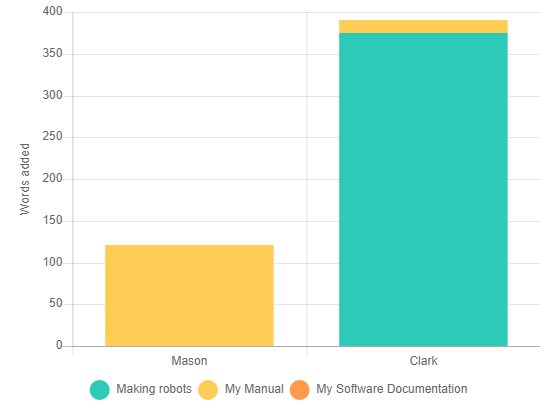
This chart does not show a historical trend, it offers a bar chart of data grouped by contributors and then by projects. It helps you figure out your top contributors during a spring or a release cycle.
By Projects
This is another view for the content contribution data: Reports → Words Added → By Projects. This chart shows trend lines for all your projects, so you can see how much content was contributed to each project over time.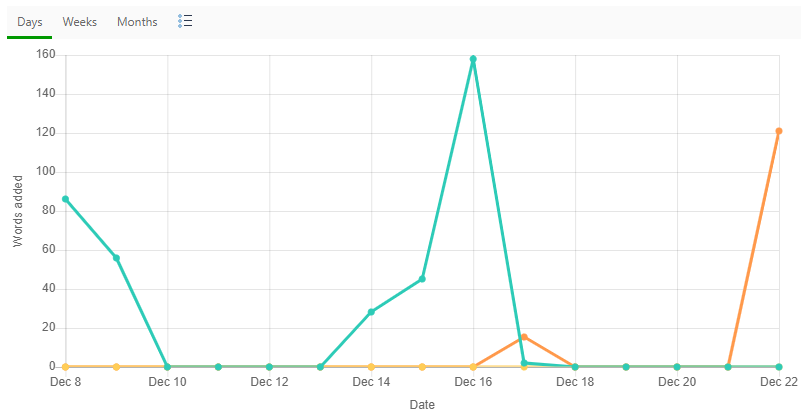
All the screenshots above represent the Entire Portal view of data. You can see the same reports for a specific project - just select it in the Report for drop-down box in the report header panel. Moreover, you can group, sort and filter projects. Learn more on this here: Working with Data Tables.