Topic Metrics Reports
The Topic Metrics reports section helps you to count the number of words, characters, sentences, etc., in your topics, as well as the number of various items, like images, tables, videos, etc., inserted in your topics. This helps to make sure that your documentation will be clear for your readers. In addition, you can estimate the readability score of your topics based on any of the available text metrics.
Topic Metrics reports include:
All these reports are available both for projects and publications. You can open them from the Projects page by clicking Portal → Reports in the left-hand navigation panel. The Report Center page will open. Then click Topic Metrics in the left-hand navigation panel and click a report that you need. Below we've described every Topic Metrics report in detail.
Text Metrics Report
This report will help you estimate how many words, characters, sentences, syllables, and the like are in your topics.
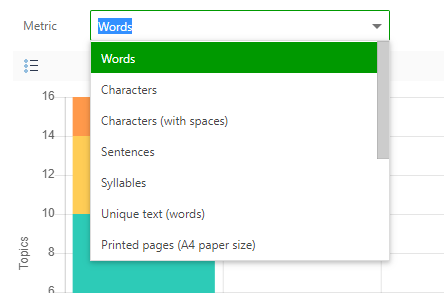
You can select the necessary text metric from the dropdown list that is in the
top-left corner.
Here is what the data looks:
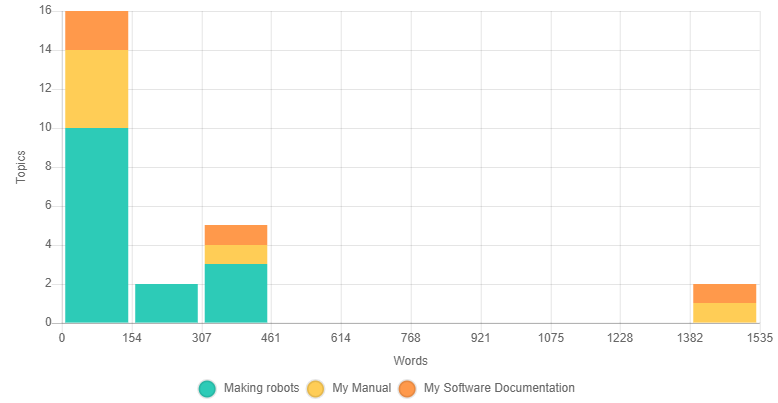
It's the histogram that represents the distribution of the number of topics according to the selected metric's numerical value. A tooltip of every bar shows the interval in the mathematical notation (a square bracket means that the boundary of the interval is included, and the parenthesis means that the boundary value is not included).
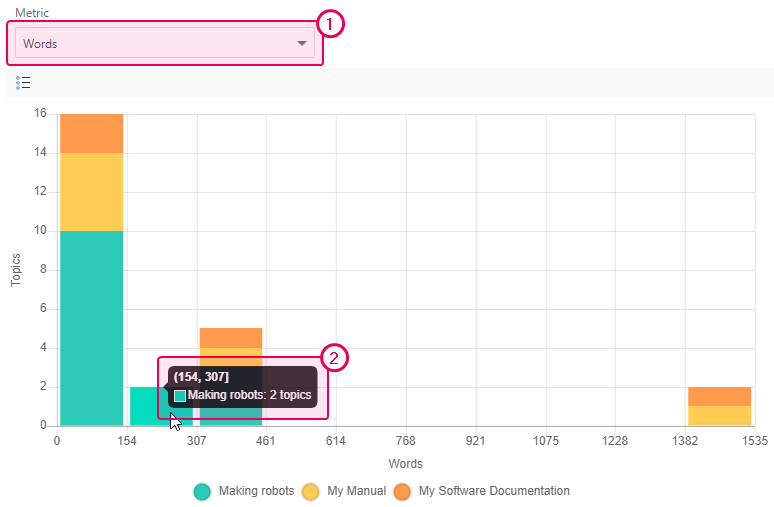
According to the example above (we've chosen the Word metric), the majority of topics in the portal documentation have less than 154 words.
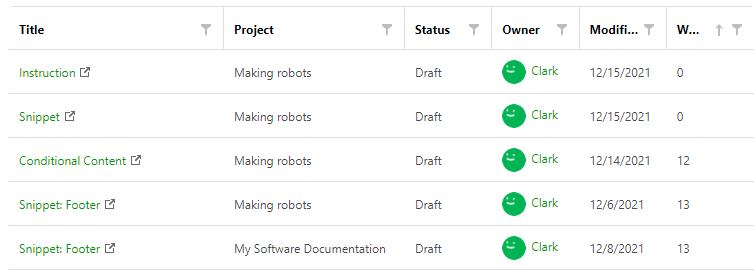
There is a data table under the chart with more information. Here is how it
looks:
To learn more, refer to this topic: Text Metrics.
Readability Report
This report will help you estimate the readability score of your topics - how easy it is to read and understand your content.
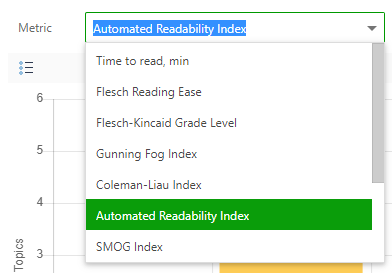
You can select the necessary text metric from the dropdown list that is in the top-left corner.
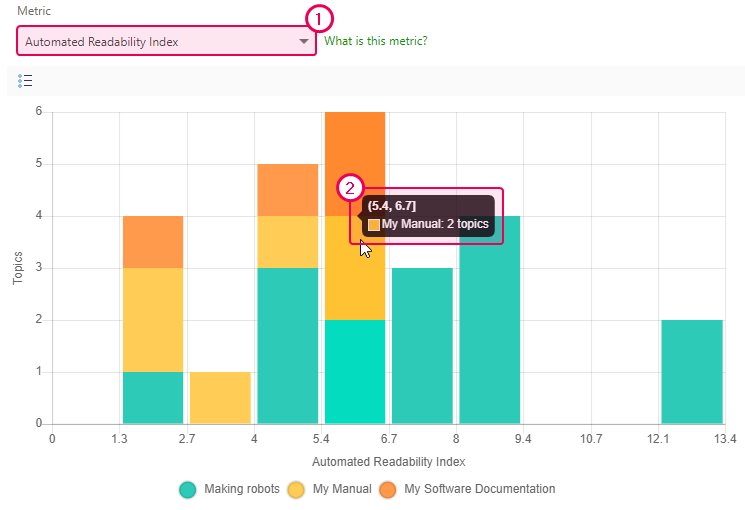
Here is what the data looks:
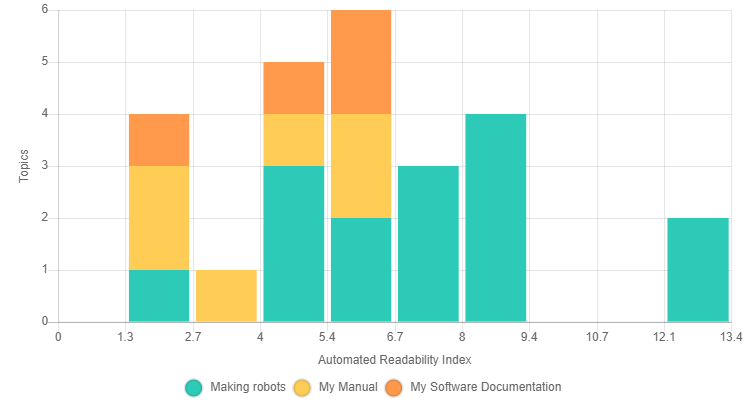
It's a histogram that represents the distribution of the number of topics
according to the selected readability metric's numerical value. A tooltip
of every bar shows the interval in mathematical notation.
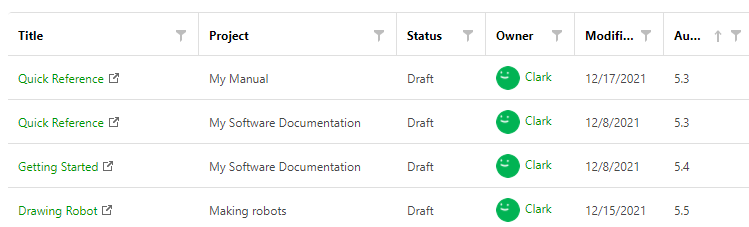
There is a data table under the chart with more information. Here is what it looks like:
To learn more, refer to this topic: Readability Metrics.
Item Count Report
This report will help you estimate how many images, links, tables, and other items are in your topics.
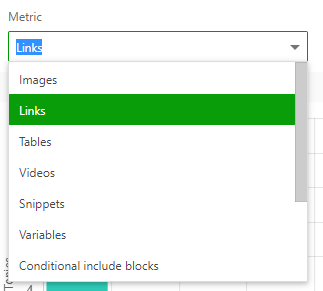
You can select the necessary metric from the dropdown list that is in the top-left corner.
Here is what the data looks like:
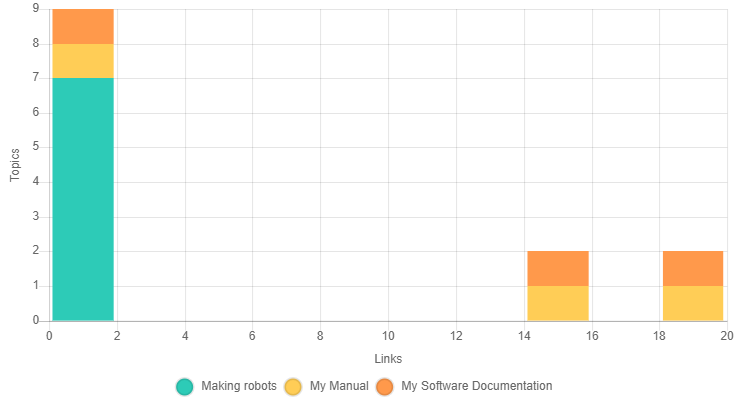
It's a histogram that represents the distribution of the number of topics
according to the selected readability metric's numerical value. A tooltip
of every bar shows the interval in mathematical notation.
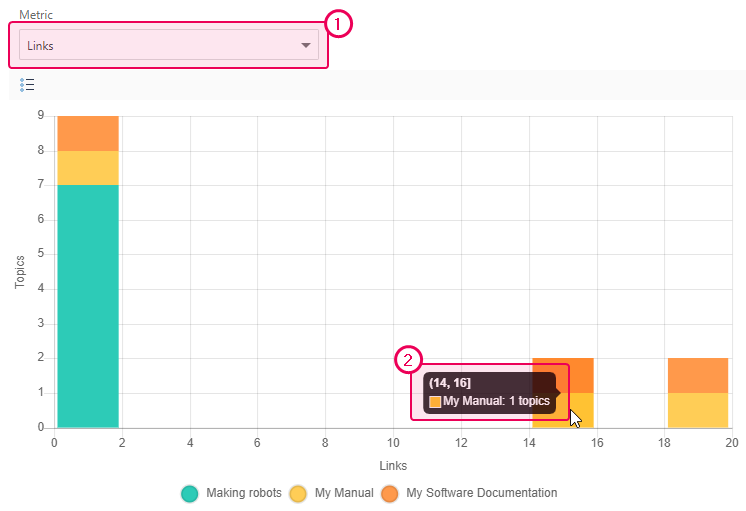
According to the example above (we selected the Links metric), the My Manual project has 1 topic with more than 14 links in it.
There is a data table under the chart with more information. Here is what it
looks like:

To learn more, refer to this topic: Item Count Metrics.
All the screenshots above represent the Entire Portal view of data. You
can see the same reports for a specific project or publication - just select
it in the Report for dropdown box in the report header panel. Moreover,
you can group, sort, and filter projects. Learn more on this here: Working with Data Tables.