
Whenever you buy a product, the cost of data analysis is included in its price. No matter what it is, a broom, a rug, a croissant, or some software, you always pay for the data analysis that was carried out to tailor this product, especially for you. This product has reached you because you have paid for it. You have paid an advertiser, a copywriter, or a technical writer to bring this product closer to you, making it more understandable and usable.
And this is why you have the croissant on your plate and the software on your PC. It is because somebody has explained this product in clear and simple language that it is wholesome, tasty, trendy, or efficient.
This blog will explain how data analytics is related to technical writing, how to get the most out of data analysis, and how to make it cheaper.
What Is Data Analytics?
The main idea behind technical writing is to speak the same language with the users. A common language can make complex things simple for a wide audience of readers. The key to mastering this language is understanding what the users want. It can be achieved through data analytics. It can be customer support tickets, customer requests, etc. It doesn’t matter what data are analyzed as long as it helps to create improved technical documentation that meets the customers’ needs.
Data analytics is a set of tools that can help you monitor the efficiency of your knowledge base, your product, and your website. It allows you to monitor, modify, and adjust such parameters as customer feedback, product usage, feature requests, and many more.
More importantly, data analytics serves as a basis for data-driven decision-making. As a result, you not only collect data but introduce changes based on these data. As a result, the efficiency of your content is enhanced, the whole process becomes more cost-efficient, and your customer support team is much happier.
Benefits of Data Analytics in Tech Writing
Creating technical documentation with the help of data analytics can improve the outcome metrics. In practice, it means that your support specialists will get fewer tickets and phone calls. As a result, your support team will witness an overall growth in customer satisfaction. With this in mind, let’s look closely at these (and other) benefits.
- Deflection of customer support tickets. One of the ideas of tech writing is to produce documentation that eliminates most questions from customers. This can be achieved when technical writers look at things from the users’ standpoint. If the issue is explained properly and a good solution is offered right in the text of the manual or user guide, there will be no need for the customer to call support. Your support team will be relieved, and the problem will be diverted or ‘deflected’ (a word often used by specialists).
- Monitoring feedback. Customer feedback cannot be reduced to support tickets only. It includes the number of likes and dislikes your product gets. The ratio of likes and dislikes is also an important indicator. If you collect such data, you can monitor the customer feedback dynamics. Putting it simply, if the negative feedback increases, it means that you have to improve your documentation quality.
- Enhancing the readability score. Data analytics can help you understand which content on your website is popular (readable) and which is ignored (unreadable). This can be achieved by analyzing visit duration and bounce rate (when the visitor finds the content useless and immediately leaves the page). With this information, your team of writers can improve the content to increase its readability.

What Data Should Be Used?
The data collected for analytics can be grouped into the following clusters:
- Customer support tickets.
- Product usage data.
- Google Analytics.
- Customer Feedback.
- Customer Requests.
Each of the clusters above needs a ‘close-up,’ so let’s focus on each of them.
The support team receives customer support tickets after a customer fills in a form where they describe the problem and formulate a question to be resolved. This data usually serves as a base for troubleshooting guides written by technical content writers. Such guides are effective only if they are based on life experience. The latter is especially valuable if it is the life experience of users, not tech writers. Of course, the writers should test the product themselves, but in reality, they are too close to the production process and know ‘too much’ to be objective. The experience of a beginner user is most valuable in this respect.
Before creating a troubleshooting guide (as well as any other content), the tickets are collected and analyzed. Then, recurring issues are singled out. They are categorized according to topics (more general issues). Then, the issues are prioritized based on the frequency principle: the most frequently asked questions make the top of the list. As a result, a structure of the document is formed, which is represented in the TOC (Table of Contents).
Product usage data is the next data type to be considered. It encompasses such points as customer usage behavior, recurring steps, and routes the customers use to solve their business problems with the help of your software product. This information helps content authors structure their texts accordingly (a good text usually corresponds to the customer behavior).
Google Analytics provides a variety of tools that will help you to find out how customers use the knowledge base on your site. You can learn about the following aspects of the customers’ behavior:
- how the users find your site
- how they navigate it
- what content they consider to be interesting
- what content is ignored and bounce rates (when a visitor looks at a page and then clicks the Back button)
- visit duration (how long they read content)
- overall traffic volume: the number of people reading your content for a given period (per year, month, quarter, or day)
- the ratio of new and returning visitors
- the keywords they use in the search tab.
All this information helps technical writers to understand how customers perceive and use the content. The latter can be optimized based on this knowledge. For example, if the bounce rate is high, you may have chosen the wrong target audience, and your tech writers should customize the content to appeal to the ‘right’ visitors.
Another example concerns tracking search keywords. Using Google Analytics, you can collect the most common keywords used by customers. This information can help the writers describe the product so that it reflects how customers think of it.
Customer feedback is a data type that can be used to improve content quality. As was said above, the feedback includes support tickets, the likes and dislikes your product gets, and their ratio. All these put together can help you understand what image (in the marketing sense of the word) your product has and enhance this image.
Customer requests can also be regarded as a type of data. Quite often, even experienced users have some ‘pain points.’ This happens when they cannot understand how to use this or that feature of the product. In this situation, they usually seek help from a support service. This is how the so-called ‘feature requests’ emerge. Actually, such requests are a source of priceless information about the weak points of your product. As a rule, companies have to pay for this information to product testers, but in this case, you get it for free, making it all the more valuable. Based on this information, technical writers usually modify the existing documentation so that the product use can be explained intuitively.
Analytics and Reporting in ClickHelp
One of the most popular documentation tools used by technical writers across the globe is ClickHelp. This platform helps manage all documents in a single portal and monitor content efficiency. ClickHelp offers a whole set of features that will make analytics and reporting simple, clear, and visually attractive. The Report Center is an analytics hub where you can get all kinds of data for your project. Over a dozen reports will help you monitor project readiness, content quality, and user behavior.
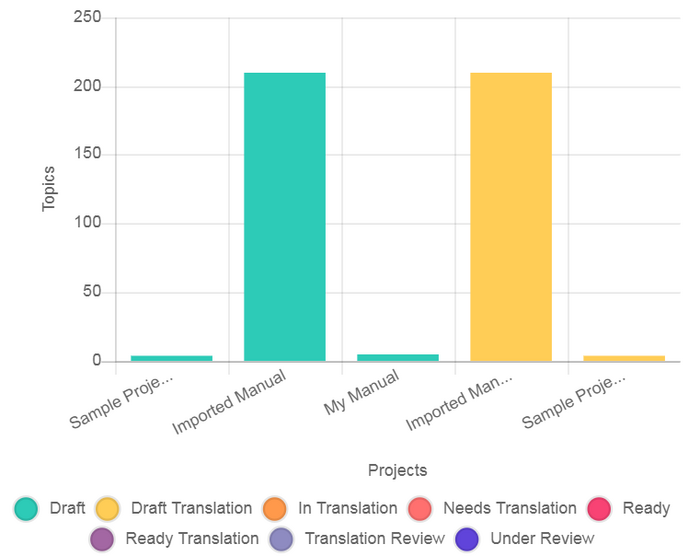
Project readiness can be monitored by document status (draft, under review, ready) or by the assignee. In the latter case, you can easily find out who of the employees has too many tasks on hand and how much content has been created by each author (author’s input).
ClickHelp also collects user behavior data: information on the content that is readable/unreadable, popular/ignored, which keywords the readers use, etc. This information will help you align your documentation with your customers’ demands.
ClickHelp has introduced a voting feature to improve customer feedback. While browsing the content, readers can like/dislike it for its helpfulness and leave comments. In the Report Center, you can monitor the number of upvotes and downvotes. This will help you figure out which topics are not considered to be helpful and modify them accordingly.
In addition, ClickHelp has several features to measure and enhance readability. It can calculate the time required to read the content and has 9 other readability metrics, like Flesch reading ease, Flesch-Kincaid Grade Level, etc.
The overall number of metrics available in ClickHelp is 30, which makes the platform a powerful tool for managing your documentation.
Conclusion
Data analytics is what marketing agencies usually sell or include in the price of their products. A simple SWOT analysis (the analysis of Strengths, Weaknesses, Opportunities, and Threats) you may order for your product will have the price of data analysis incorporated in the overall cost of the service.
ClickHelp includes a set of analytics tools you can use on a daily basis to enhance your product marketability. Give it a try, and you will see how the quality of your documentation grows from day to day.
Good luck with your technical writing!
ClickHelp Team
Author, host and deliver documentation across platforms and devices